Metrics
This guide describes how to access system metrics across different Gradient resources.
Overview
Gradient workloads can record metrics that are available both in realtime or after the workload is complete. Gradient will display these metrics in the web UI and they can also be queried or streamed in the CLI.
Gradient can log three different kinds of metrics: hardware metrics, framework metrics, and custom user metrics.
Framework and custom metrics are only available in a Gradient Private Cluster.
Please contact Sales for inquiries!
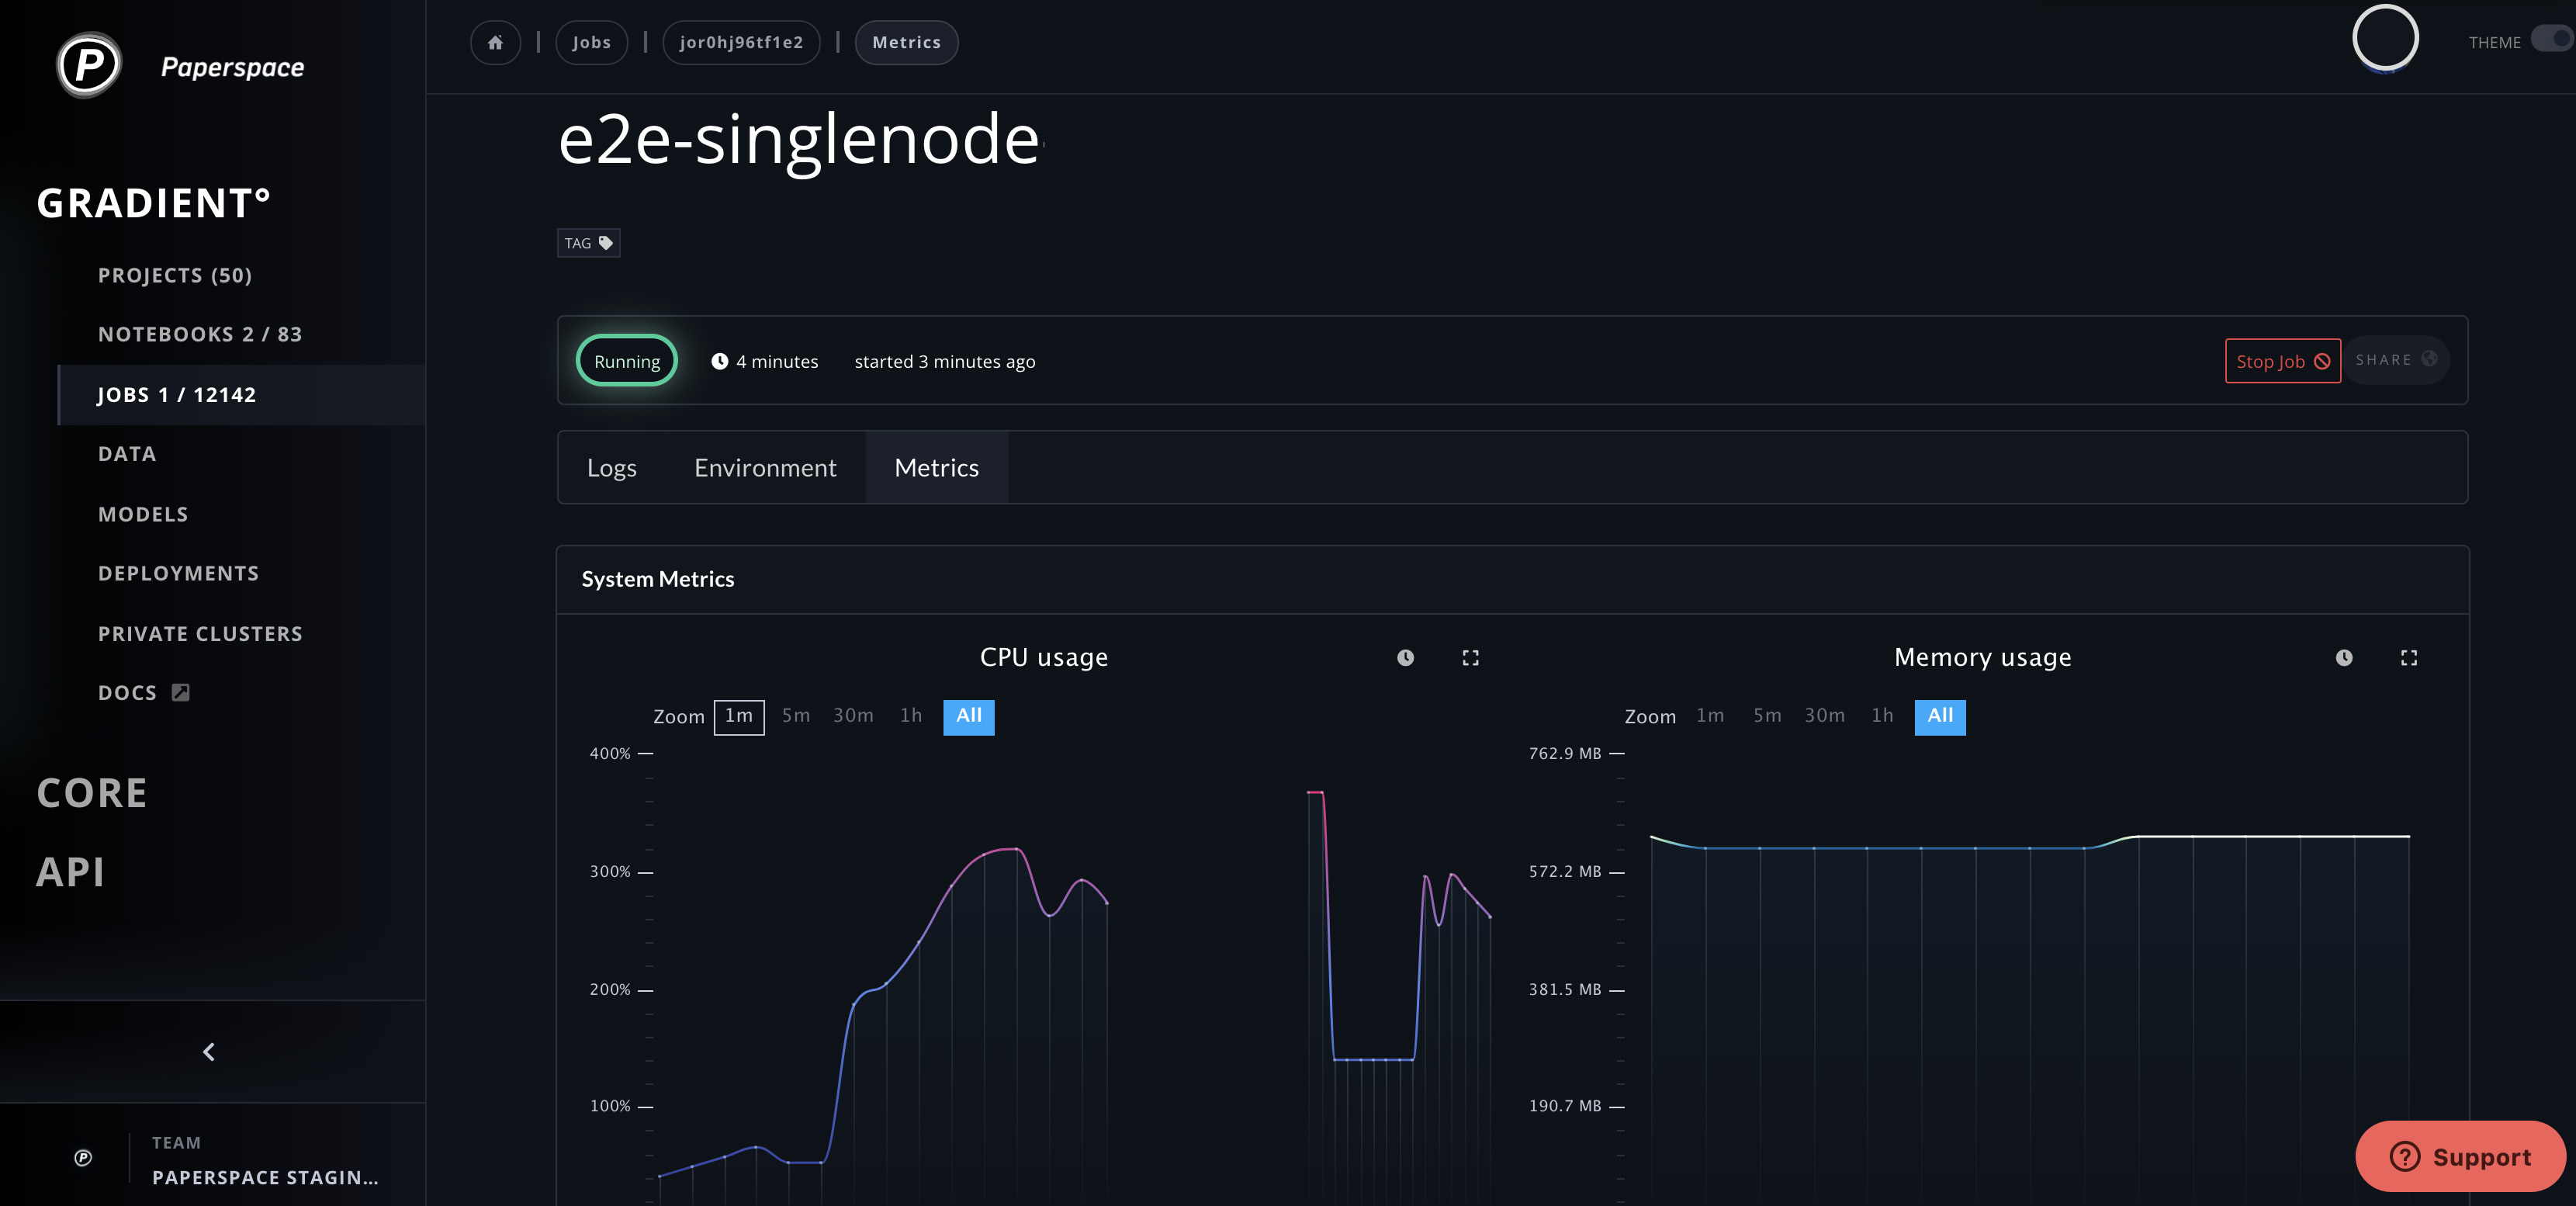
System metrics
All Gradient workloads like Experiments and Deployments monitor and track CPU, Memory, and Network. If the machine is equipped with a GPU, this will be tracked as well.
How to view metrics in the GUI
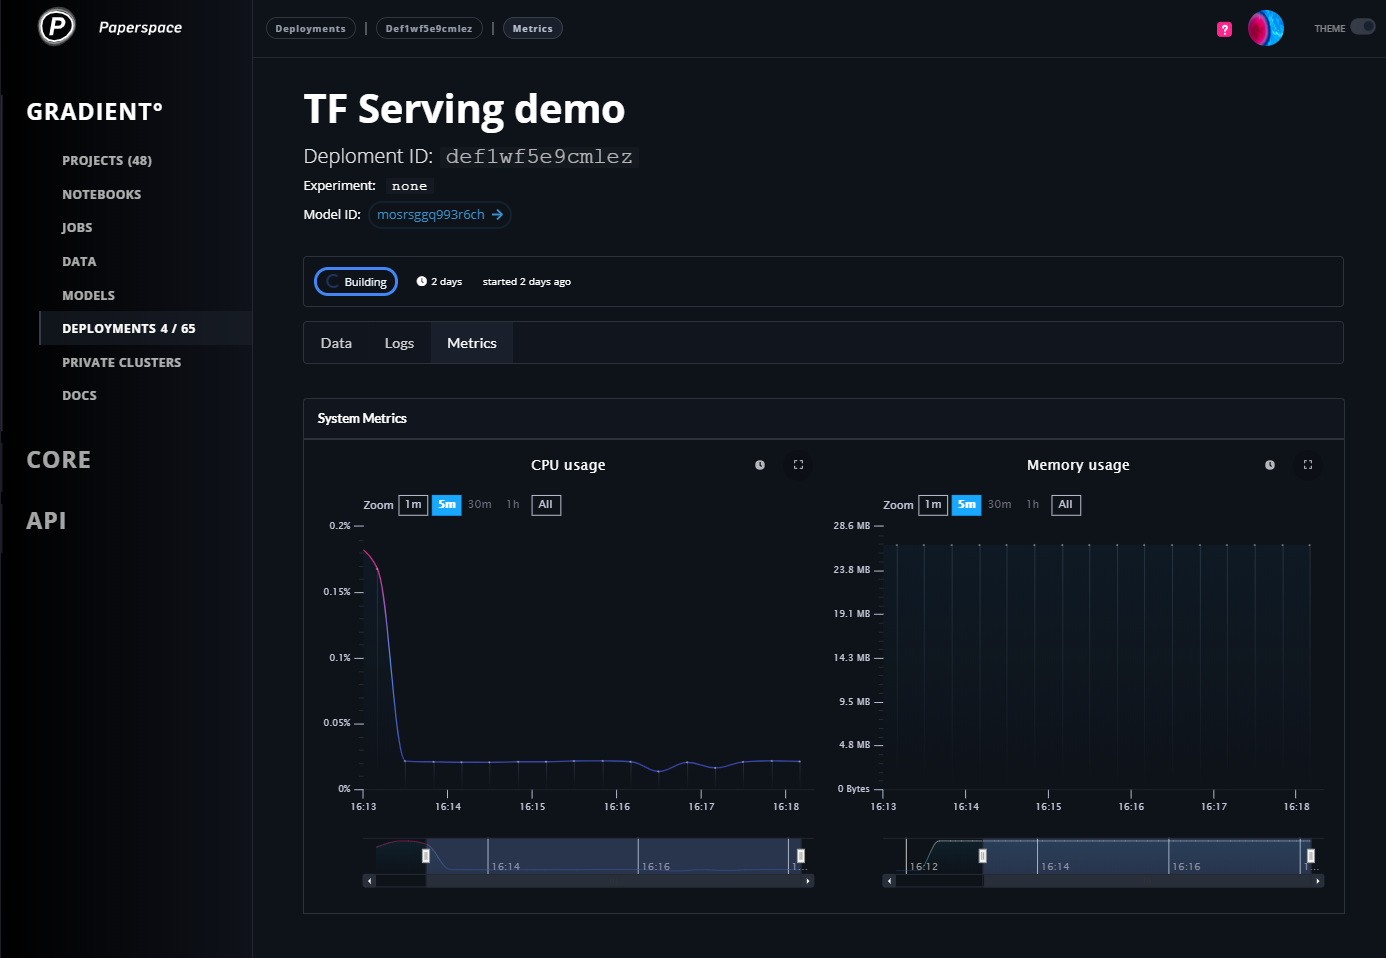
How to view deployment metrics
Deployment metrics are a Gradient Private Cluster feature. Contact Sales for inquiries!
To view Deployment metrics, navigate to the Metrics tab of the individual deployment.
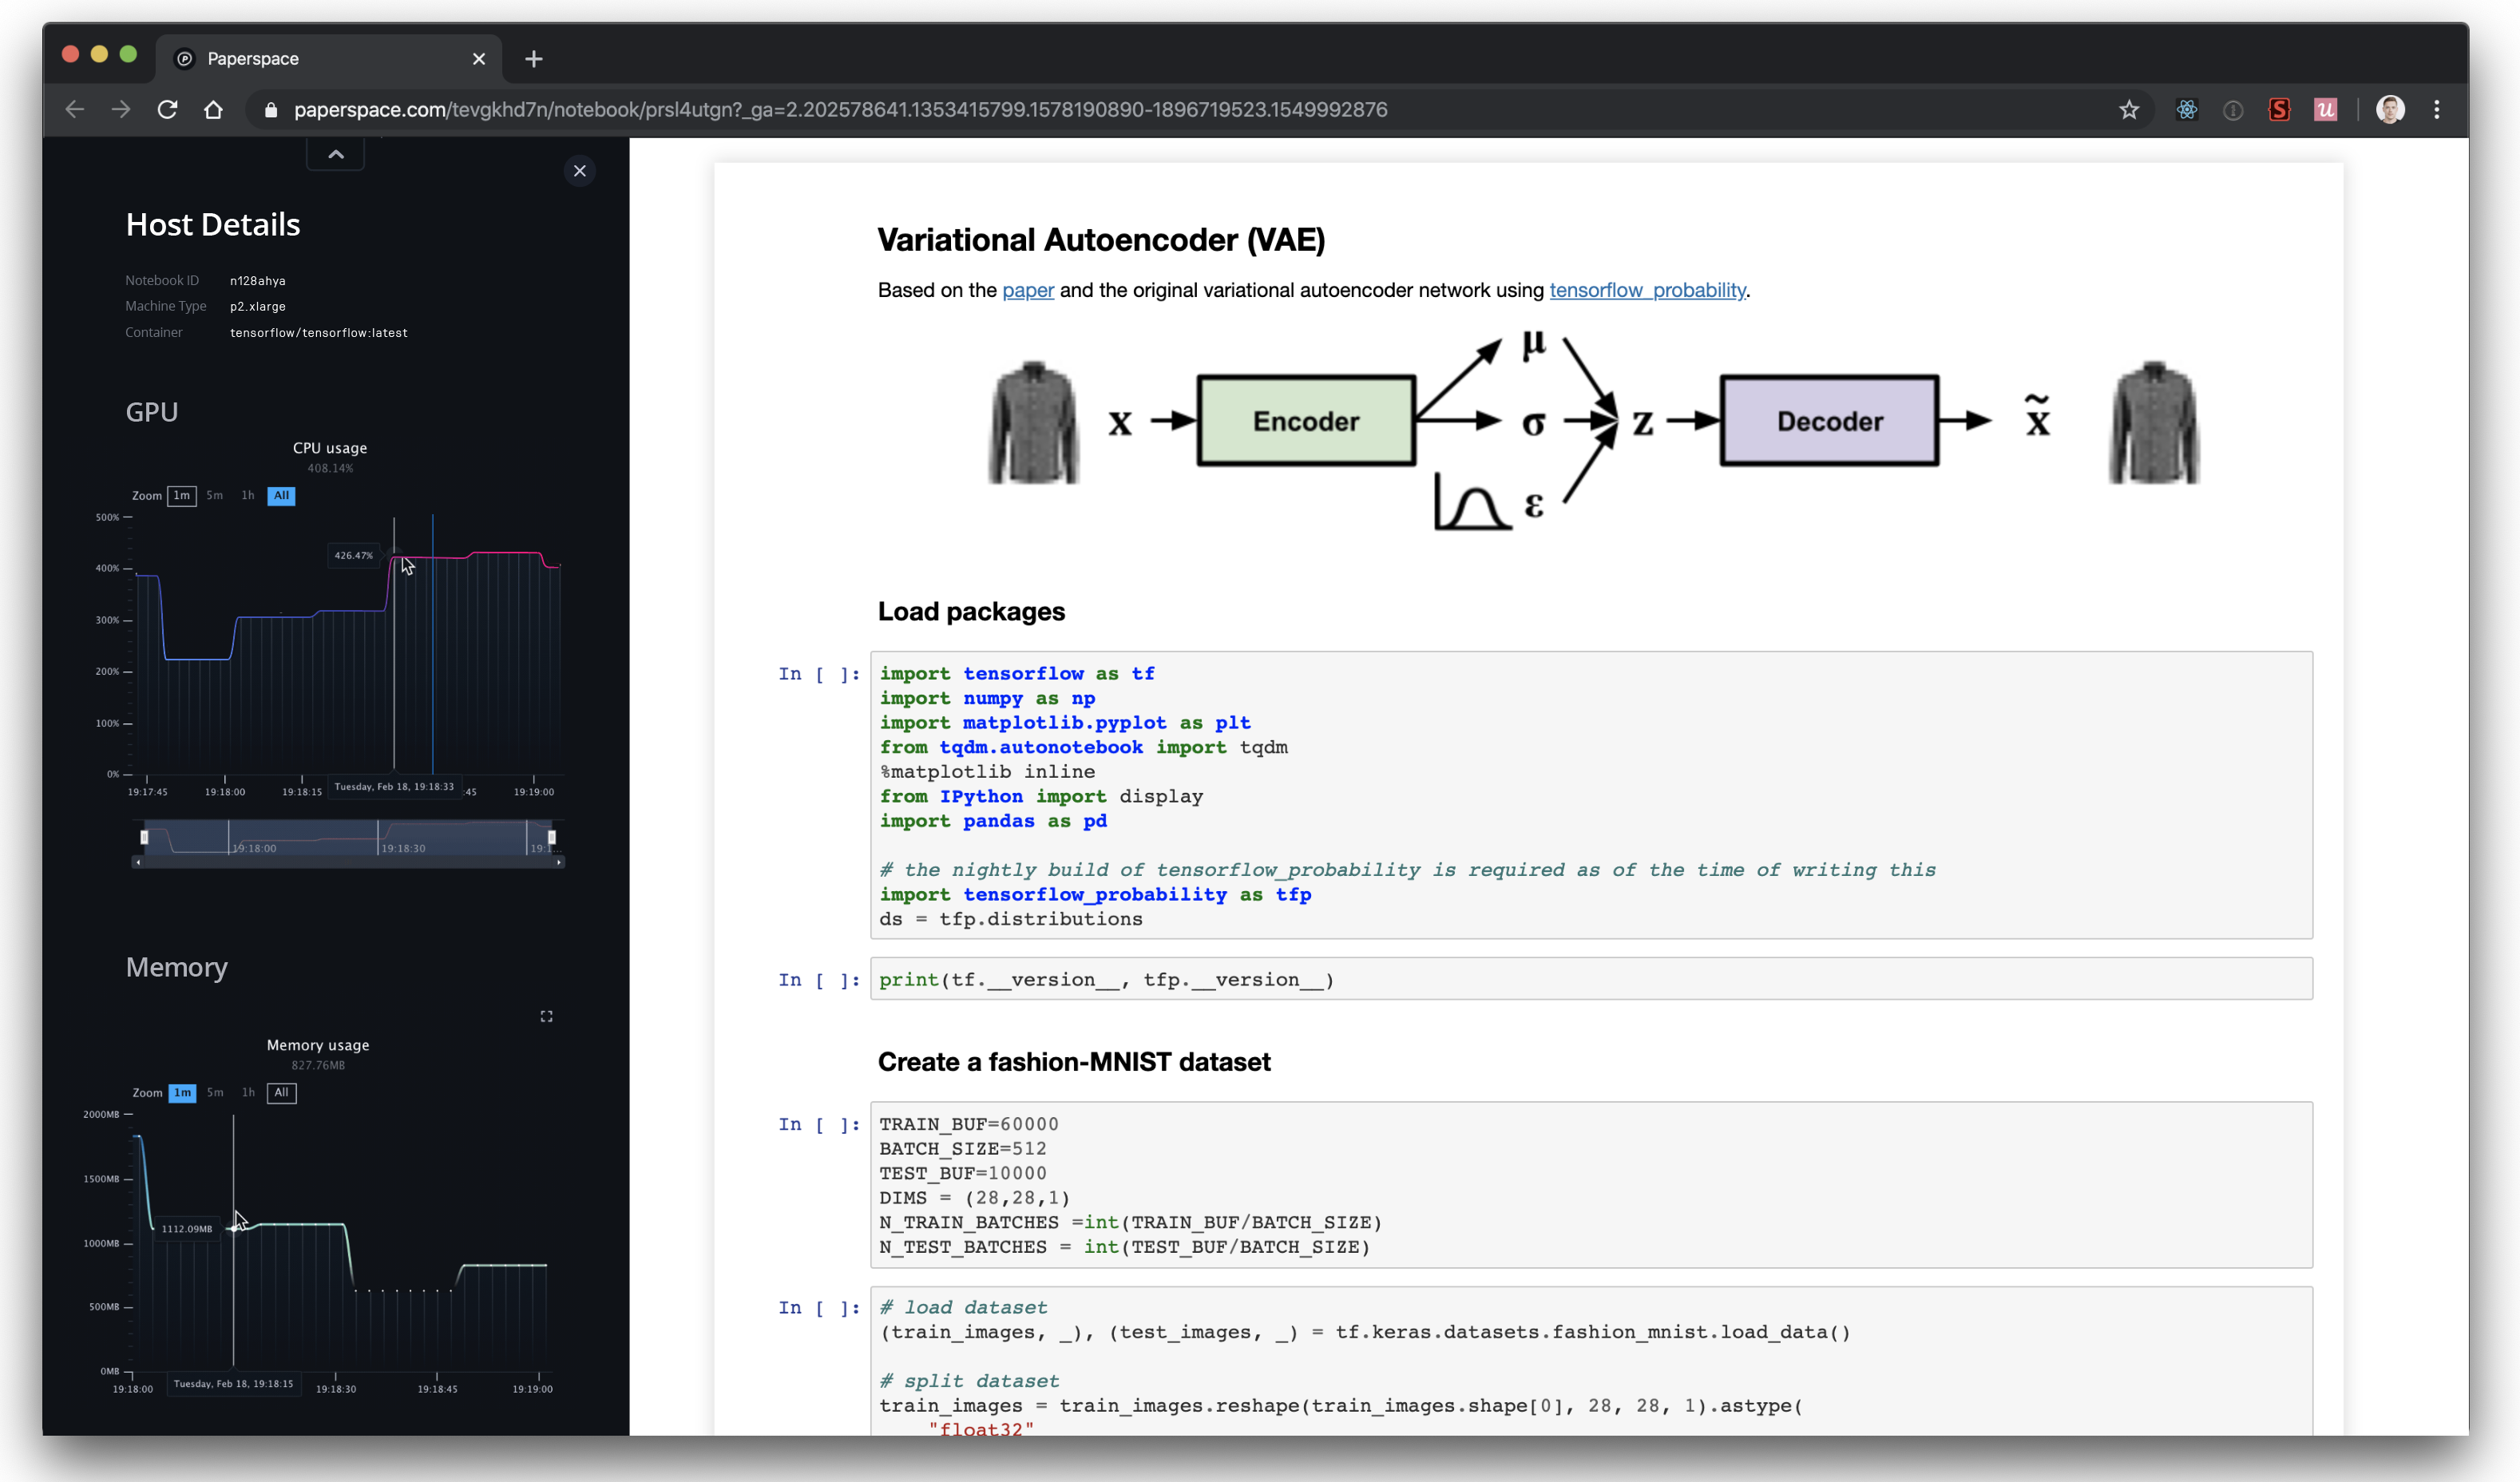
How to view notebook metrics
Notebook metrics are a Gradient Private Cluster feature. Contact Sales for inquiries!
To view Notebook metrics, you will see a minimal version in the Notebook header and you can also open a more robust display with detailed information.
How to view metrics in the CLI
To query the metrics for a given workload using the CLI, here's an example using Experiments (the Deployments and Notebooks syntax are the same).
Usage: gradient experiments metrics [OPTIONS] COMMAND [ARGS]...

  Read experiment metrics

Options:
  --help  Show this message and exit.

Commands:
  get     Get experiment metrics
  stream  Watch live experiment metrics